According to the Wall Street Journal, there are "Signs of a Suburban Comeback." This is a turnaround from the typical media coverage of US population estimates in recent years, which have more often than not heralded a "return to the cities" generally more rooted in anecdote than data.
There were always at least two problems with the "return to the city" thesis. First of all, most people who live in the suburbs came from areas outside metropolitan areas and they couldn't return to where they had never lived (see Cities and Suburbs: The Unexpected Truth). More importantly, in every year for which there is data, the net inward migration to suburbs has been far greater than to the core counties, which have nearly always had net outward migration (see Special Report: 2013 Metropolitan Area Population Estimates. Under these conditions, there could not have been net migration from the suburbs to the core municipalities.
Historical Core Municipalities: The Differences
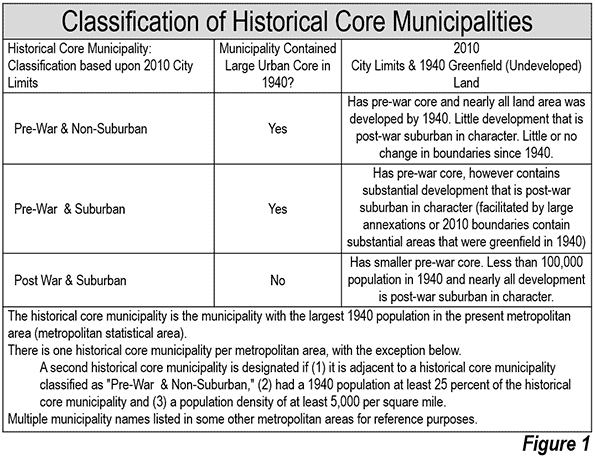
I have classified historical core municipalities based on their extent of automobile oriented suburbanization (Figure 1). The break point is World War II, after which the great automobile suburbanization occurred in the United States. There had been automobile oriented suburbanization before 1940. During the 1920s, annual rates of suburban growth exceeded five percent in the 14 metropolitan areas with more than 500,000 population. The decade of the Great Depression (1930 to 1940) saw annual growth rates drop three quarters (Note). By the end of World War II, transit had seen its motorized urban travel market share restored to 35 percent, equal to early 1920s levels, a figure that has since fallen to under two percent.
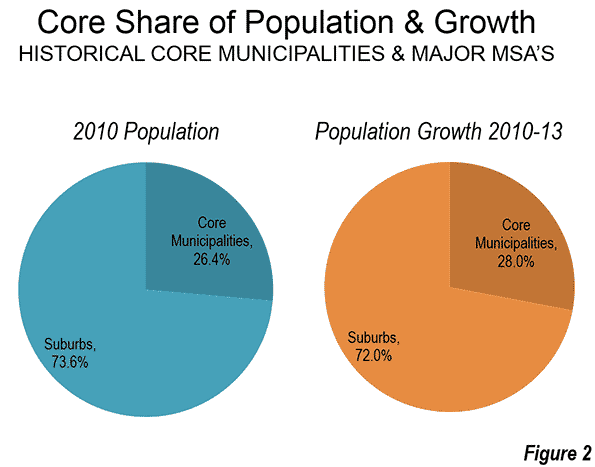
Core Municipality Growth
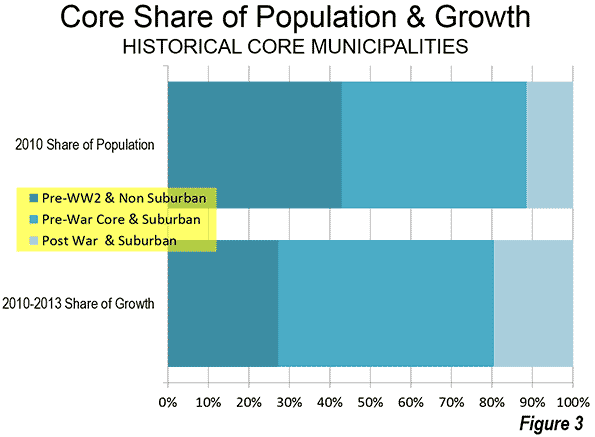
Most of the 2010 to 2013 core growth occurred in municipalities with a larger suburban component. The core municipalities that have little suburban development ("Pre-War & Non-Suburban") had 43 percent of the core population in 2010. Yet they attracted only 27 percent of the growth (Figure 3). The two other categories, which include large areas of functional suburbanization (low density and strong automobile orientation) attracted 73 percent of the core population (Figure 3). These include suburbanized pre-War core municipalities, such as Los Angeles, Seattle, and Atlanta. They also include cores that are nearly all suburban, with nearly all of their population growth having occurred during the great automobile suburbanization (such as Austin, Sacramento, Phoenix, and San Jose).
------------------
Suburban Areas: Top Gainers
The largest suburban gains were in Dallas-Fort Worth (325,000), Houston (296,000), Washington (269,000), Miami (245,000) and Los Angeles (211,000). Atlanta, which had virtually set the world standard for suburbanization before the Great Financial Crisis, managed to re-emerge with the sixth fastest largest suburban increase (208,000).
Measured on a percentage basis, Texas dominated the suburban gains. The suburbs of Houston added 7.8 percent to their population between 2010 and 2013. Austin added 7.7 percent, San Antonio added 6.6 percent, and Dallas-Fort Worth 6.2 percent. The only non-Texas entry in the top five was Raleigh, which, like Austin, posted a 7.7 percent increase.
The metropolitan area and historical core municipality data is summarized in the Table.
- read more here:
From Anecdotes to Data: Core & Suburban Growth Trends 2010-2013 | Newgeography.com


 Reply With Quote






Bookmarks