


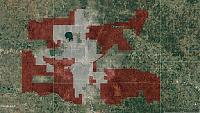
Map I made using Google Earth. I used Census 2017 5-year population estimates to add up the densest block groups within OKC (2017 5-year estimate for the city is 629,191).
The areas shaded in white contains approximately 531,762 residents (84.5% of total pop.) within 166 sq mi (27.7% of total land area) for a density of 3,204/sq mi.
The remaining 435 sq mi shaded in red contains approximately 97,429 residents for a density of 224/sq mi.


 Reply With Quote
Bookmarks